+91-8007480300

This is NOT an attempt to thwart age old belief systems, but a question asked to those financial wizards about the value addition obtained through putting individual investors into silos according to what they THOUGHT about risk!
The question is ' What should determine the risk appetite of an individual?'
The general methodology used to find the risk appetite of an investor is through a risk profile questionnaire, the snippet of a typical one is given below.
The flurry of questions is followed by a judgment based on the total score obtained. The typical partitioning would happen as follows:
| Score | Investor profile | Description |
|---|---|---|
| 0 - 6 | Conservative | Your risk appetite is extremely low and prefer to protect your capital |
| 7 - 15 | Moderately Conservative | You are prepared to take a small risk on your capital |
| 16-25 | Moderately Aggressive | You are willing to take enough risk to overcome inflation |
| >25 | Aggressive | You are prepared to lose your capital in pursuit of very high returns |
It can be seen that the major aspects which are attempted to be identified here are,
a. The life stage of the individual in a generic way
b. The 'response' of the individual towards market conditions and his 'feeling' about the various instruments
c. The 'time horizon' an individual 'thinks' he has for a particular instrument
d. His 'apparent' awareness and comfort level about the various financial instruments
Further, it is expected that the investment portfolio be prepared based on the category that the individual falls into. On the face of it this method looks just perfect, and is therefore employed by major banking and financial services companies. It connects well with investor behavior and a portfolio developed thus will be readily accepted by him.
However, the fundamental flaw in this method is that, neither does it address, nor consider the very purpose/purposes for which the investment portfolio is made. This seems more like a doctor trying to prescribe a medicine based on what the patient 'thinks' about his illness rather than on the basis of what medicine the patient 'should' be taking to cure his illness!
Lets take an example to illustrate this flaw. Mr. X, aged 40 wants to provide for the higher education of his child whose inflation adjusted cost is ₹ 12.5 lacs, 7 years from now. To generate this amount, he is capable of putting aside 1 lac every year. For the moment let's assume that through the above mentioned questionnaire, Mr. X scored 13 points, he would fall into the category of a moderately conservative investor. However, in order to create a corpus of ₹12.5 lacs in 7 years, the required rate of return comes to 19% p.a. (putting '=RATE(7,-100000,0,1250000,0)' in excel) which means that he needs to be considerably aggressive to achieve his goal. If he chooses to remain moderately conservative and create a portfolio giving say only 10% p.a., he would be able to generate only ₹9.5 lacs (putting '=FV(10%,7,-100000,,0)' in excel). Sticking to 'what he is' according to the risk profiling method would under provide his goal by almost 25%!
This problem can be solved by 2 methods.
a. By increasing the contribution to 1.31 lac p.a.(putting '=PMT(10%,7,0,1250000,0)'in excel)
or
b. By changing his investor profile to aggressive
In many cases, especially for people having limited income sources, it would be very difficult to choose option A which leaves B as the only option rendering the whole exercise of risk profiling useless.
Lets take another scenario where Mr. X turns out to be an aggressive investor according to his risk profile, however he is capable of shelling out 1.5 lacs p.a. towards the same goal. The required return in this case becomes 6% p.a. which is the risk free return! In this case, does he still need to behave aggressively just because he 'likes' it that way? Will he not be taking the risk of jeopardizing his goal, if something goes majorly wrong with risky investments?
In practice, the situation would be more complicated with multiple goals spaced out at different points in his life requiring different amounts of money, and quite possibly, fulfillment of those goals would require the investment portfolio to be performing in a particular fashion which may not mirror his 'risk appetite'.
Another impressive method on risk profiling is the combination of utility indifference theory and efficient frontier theory. This majorly looks at optimizing the degree of 'satisfaction' of the investor.
A utility indifference curve is plotted between two variables in which each point represents the pair of values which leads to the same degree of satisfaction. Here it is drawn between various combinations of risk and return. As we know, a risk averse investor would agree to trade off some returns in lieu of a reduction in risk. However the degree of trade off in return per unit of risk reduction would continuously diminish for the same level of satisfaction as illustrated in the figure below.
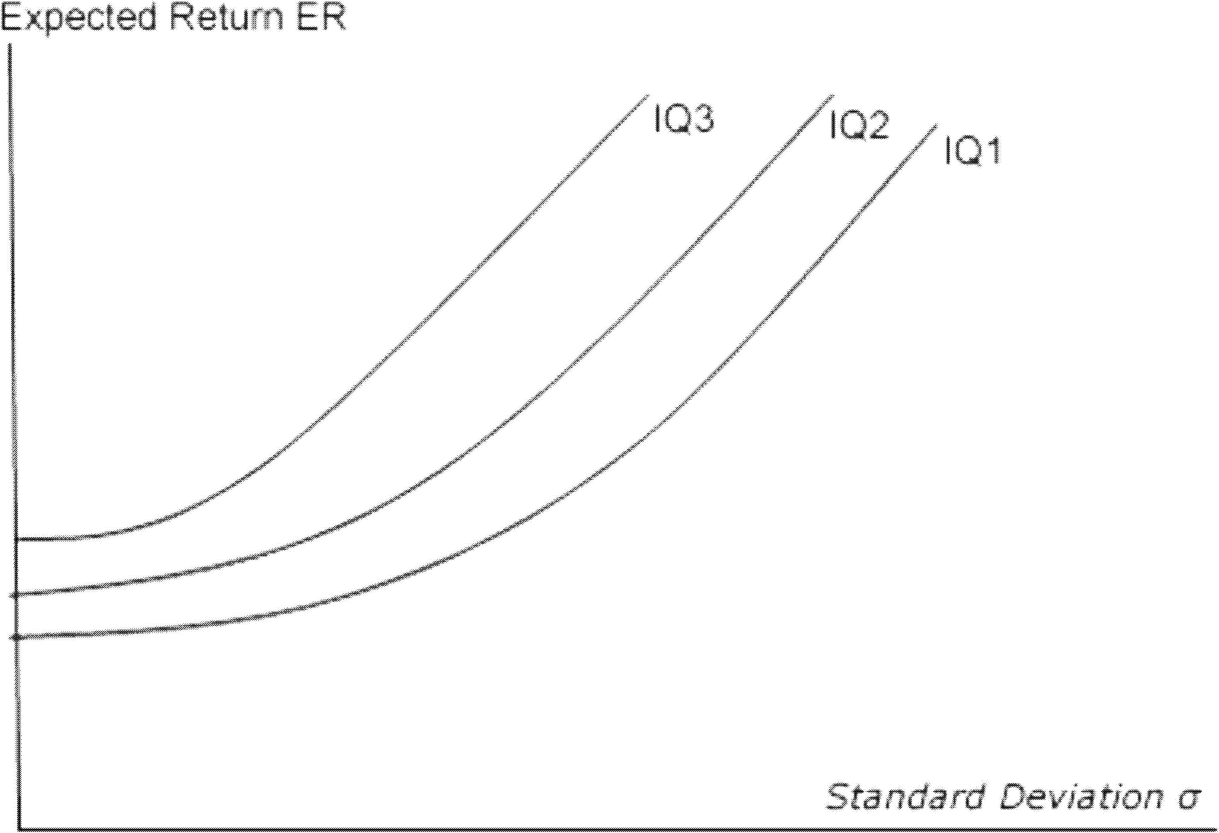
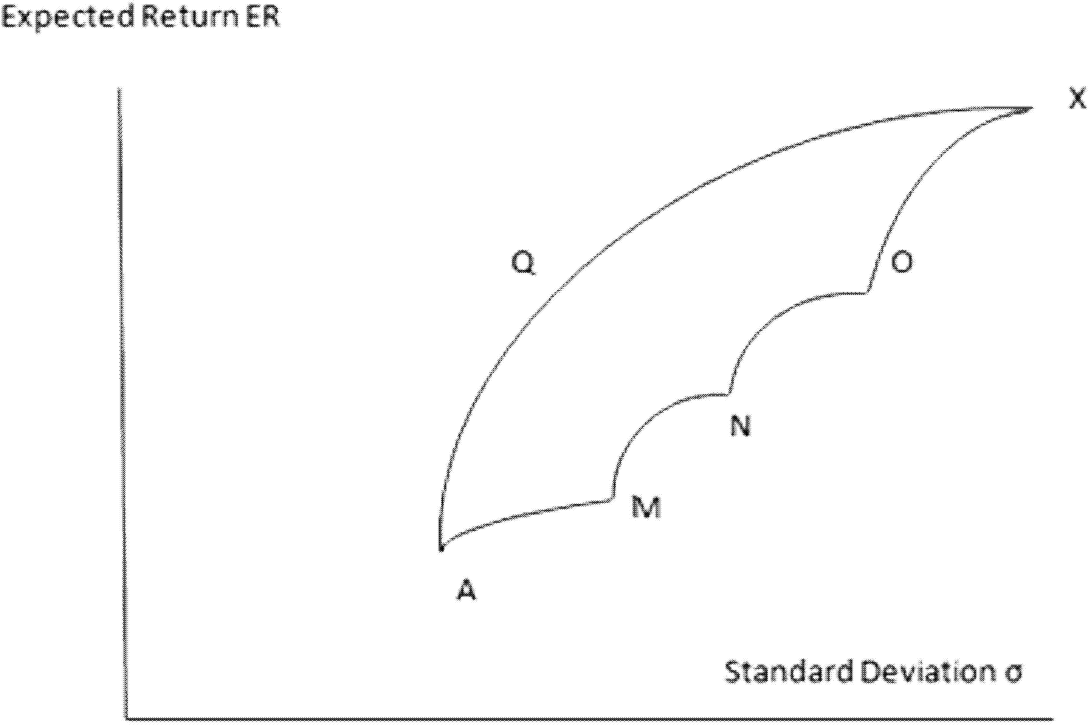
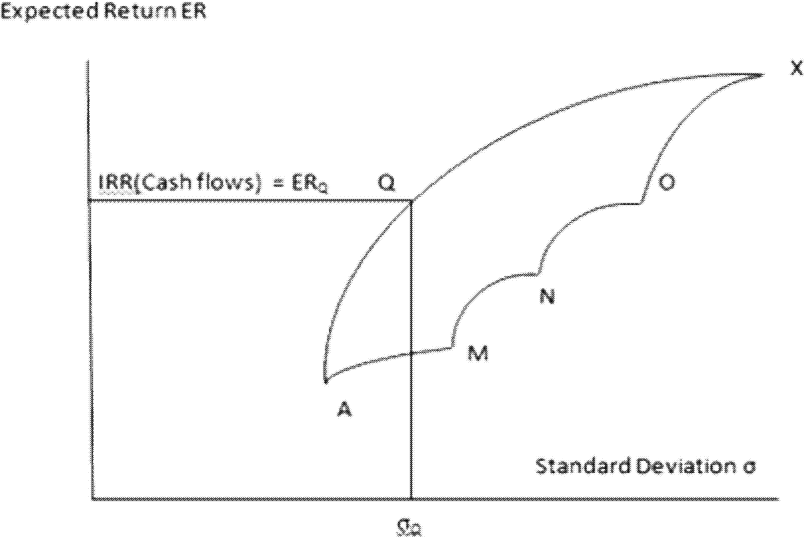
IQ1, IQ2, IQ3 are indifference curves representing different levels of satisfaction with the degree of satisfaction increasing as we move leftwards. We can see that the slope of the curves are reducing as it comes down indicating that to maintain the same level of satisfaction, individuals are willing to sacrifice lesser amounts of return with respect to the reduction in risk. Efficient frontier is the plot of such portfolios which are the least risky ones for a given expectation of return. As the figure below indicates, the curve AQX represents the efficient frontier, while the complete curve AQXONM and the points within the curve represents all possible combinations of the various assets in different proportions.
It is obvious that individuals would prefer to invest in those portfolios which lie on the efficient frontier. However the dilemma is which portfolio on the efficient frontier to choose! Here we can use the utility indifference curves and choose the optimal portfolio, which is the point on the efficient frontier that is tangential to the investor's highest indifference curve so that the degree of satisfaction is the highest possible. The point Q in the figure given below is such a point. The points P and R are also points of intersections of the indifference curve IQ1 with the efficient frontier, but they represent a lesser degree of satisfaction.
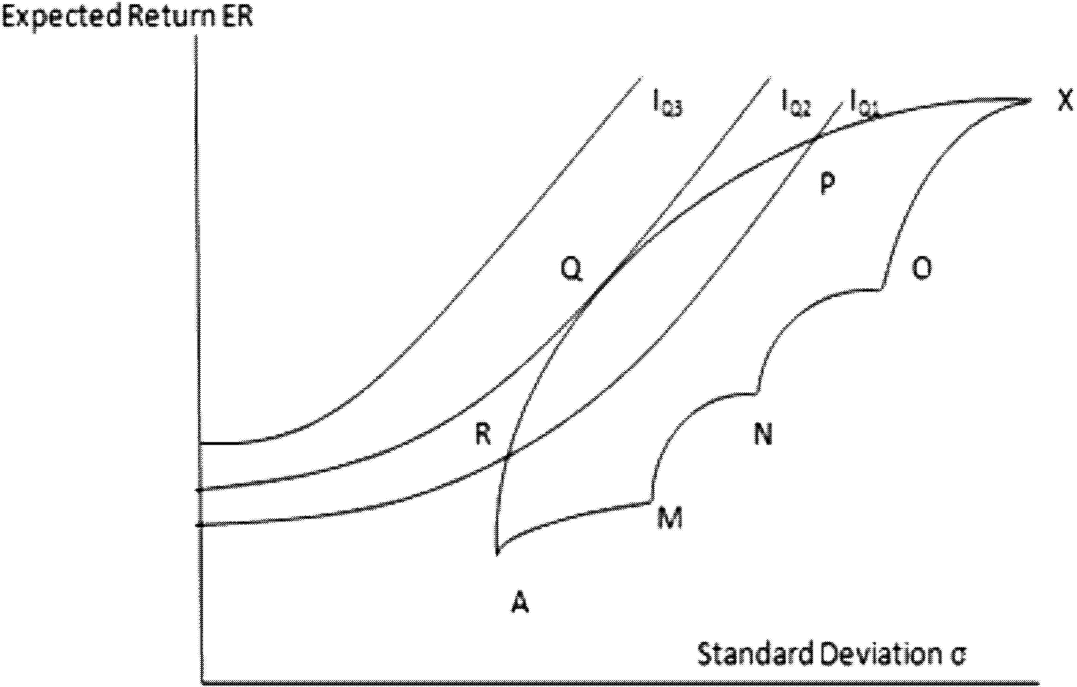
In short this method suggests the investor to identify the most optimum portfolio for him in terms of the one which has the unique properties of being efficient as well as giving him the highest 'practically possible' level of satisfaction. Though IQ3 represents a higher level of satisfaction than IQ2, there are no efficient portfolios falling on this curve and hence does not yield a practically feasible solution.
This method suggests that the risk associated with the optimal portfolio is the most optimum risk that the investor will be 'willing' to take.
Picture perfect! But what's the catch? Again this does not address the very purpose/purposes for which the investment portfolio is made. The optimum satisfaction of the investor in this method does not represent the satisfaction in terms of fulfillment of his financial goals, but in terms of what risk return combination would he find optimally 'acceptable'.
From a financial planning perspective, both these methods fail miserably and raise major doubts about the efficacy of the concept of 'Risk Profiling' as such. The most practical way therefore would be to relate the risk to be taken with the 'reasonable' financial goals of an individual rather than try to 'derive' his risk profile. The simple steps involved in this process would be as follows:
This method ensures that the individual takes sufficient risk as required by his personal financial goals/cash flows and educates him about the importance of being aware and open minded to the various available financial assets without being biased about them. It also makes the individual prepared to take on his chin the possible negative effects of the risks required to be taken by him while protecting him from taking unwanted risks just because he likes to take them. In short this method helps the financial doctors to recommend the 'medicine' that will 'cure' their clients' requirements rather than find out what 'medicine' they would like to take!
Subscribe Via Email
Subscribe to our mailing list to get the updates to your email inbox.